
پرونده:Milankovitch Variations sv.png
Milankovitch_Variations_sv.png (۴۷۹ × ۳۶۳ پیکسل، اندازهٔ پرونده: ۲۵ کیلوبایت، نوع MIME پرونده: image/png)
این پرونده در ویکیانبار موجود است. محتویات صفحهٔ توصیف آن در زیر نمایش داده میشود. |

|
File:Milankovitch Variations-es.svg یک نسخهٔ برداری از این پرونده است.
آن پرونده را هنگامی که بهتر بود میبایست به جای این نسخهٔ تصویر استفاده کرد. File:Milankovitch Variations sv.png → File:Milankovitch Variations-es.svg
برای کسب اطلاعات بیشتر در ارتباط با تصاویر برداری لطفاً اینجا را مطالعهکنید. همچنین اطلاعات بیشتری در ارتباط با حمایت مدیاویکی از تصاویر اسویجی وجود دارد. |
 |
This is a Swedish translation of Milankovitch Variations.png [1].
![[1]](https://en.wikipedia.org/wiki/Image:Milankovitch_Variations.png)
Description at the english version:
خلاصه
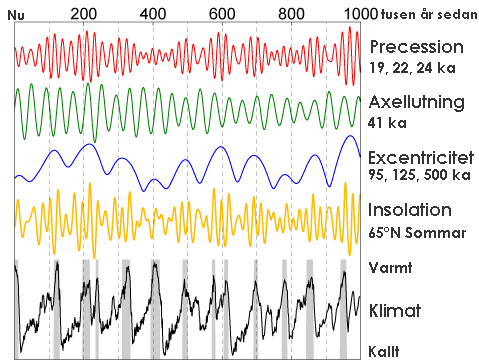
This figure shows the variations in Earth's orbit, the resulting changes in solar energy flux at high latitude, and the observed glacial cycles.
According to Milankovitch Theory, the precession of the equinoxes, variations in the tilt of the Earth's axis (obliquity) and changes in the eccentricity of the Earth's orbit are responsible for causing the observed 100 kyr cycle in ice ages by varying the amount of sunlight received by the Earth at different times and locations, particularly high northern latitude summer. These changes in the Earth's orbit are the predictable consequence of interactions between the Earth, its moon, and the other planets.
The orbital data shown is from Quinn et al. (1991). Principal frequencies for each of the three kinds of variations are labeled. The solar forcing curve (aka "insolation") is derived from July 1st sunlight at 65 °N latitude according to Jonathan Levine's insolation calculator [2]. The glacial data is from Lisiecki and Raymo (2005) and gray bars indicate interglacial periods, defined here as deviations in the 5 kyr average of at least 0.8 standard deviations above the mean.
Copyright
This image was produced by Robert A. Rohde from publicly available data, and is incorporated into the Global Warming Art project.

|
اجازهٔ کپی، پخش و/یا تغییر این سند تحت شرایط مجوز مستندات آزاد گنو، نسخهٔ ۱٫۲ یا هر نسخهٔ بعدتری که توسط بنیاد نرمافزار آزاد منتشر شده؛ بدون بخشهای ناوردا (نامتغیر)، متون روی جلد، و متون پشت جلد، اعطا میشود. یک کپی از مجوز در بخشی تحت عنوان مجوز مستندات آزاد گنو ضمیمه شده است. |
| این پرونده با اجازهنامهٔ کریتیو کامانز Attribution-Share Alike 3.0 سازگار نشده منتشر شده است. | ||
| ||
| این برچسب مجوز بهعنوان بخشی از روزآمدسازی مجوز GFDL، به این پرونده افزوده شد. |
References
- Lisiecki, L. E., and M. E. Raymo (2005), A Pliocene-Pleistocene stack of 57 globally distributed benthic d18O records, Paleoceanography 20, PA1003, doi:10.1029/2004PA001071.[3]
- Quinn, T.R. et al. "A Three Million Year Integration of the Earth's Orbit." The Astronomical Journal 101 pp. 2287-2305 (June 1991).
تاریخچهٔ پرونده
روی تاریخ/زمانها کلیک کنید تا نسخهٔ مربوط به آن هنگام را ببینید.
| تاریخ/زمان | بندانگشتی | ابعاد | کاربر | توضیح | |
|---|---|---|---|---|---|
| کنونی | ۱۴ دسامبر ۲۰۰۶، ساعت ۱۷:۲۹ | | ۴۷۹ در ۳۶۳ (۲۵ کیلوبایت) | Shinzon | This is a Swedish translation of Milankovitch Variations.png [http://en.wikipedia.org/wiki/Image:Milankovitch_Variations.png]. Discription at the english version: == Description == This figure shows the variations in Earth's orbit, the resulting chan |
کاربرد پرونده
صفحههای زیر از این تصویر استفاده میکنند:
کاربرد سراسری پرونده
ویکیهای دیگر زیر از این پرونده استفاده میکنند:
- کاربرد در ar.wikipedia.org
- کاربرد در as.wikipedia.org
- کاربرد در bh.wikipedia.org
- کاربرد در bn.wikipedia.org
- کاربرد در cy.wikipedia.org
- کاربرد در diq.wikipedia.org
- کاربرد در en.wikipedia.org
- کاربرد در en.wikiversity.org
- کاربرد در hi.wikipedia.org
- کاربرد در hr.wikipedia.org
- کاربرد در kbd.wikipedia.org
- کاربرد در kk.wikipedia.org
- کاربرد در kn.wikipedia.org
- کاربرد در ko.wikipedia.org
- کاربرد در la.wikipedia.org
- کاربرد در lo.wikipedia.org
- کاربرد در lt.wikipedia.org
- کاربرد در mai.wikipedia.org
- کاربرد در mnw.wikipedia.org
- کاربرد در new.wikipedia.org
- کاربرد در nn.wikipedia.org
- کاربرد در no.wikipedia.org
- کاربرد در pa.wikipedia.org
- کاربرد در sh.wikipedia.org
- کاربرد در simple.wikipedia.org
- کاربرد در sr.wikipedia.org
- کاربرد در sv.wikipedia.org
- کاربرد در tcy.wikipedia.org
- کاربرد در th.wikipedia.org
- کاربرد در ug.wikipedia.org
- کاربرد در uk.wikipedia.org
- کاربرد در vi.wikipedia.org