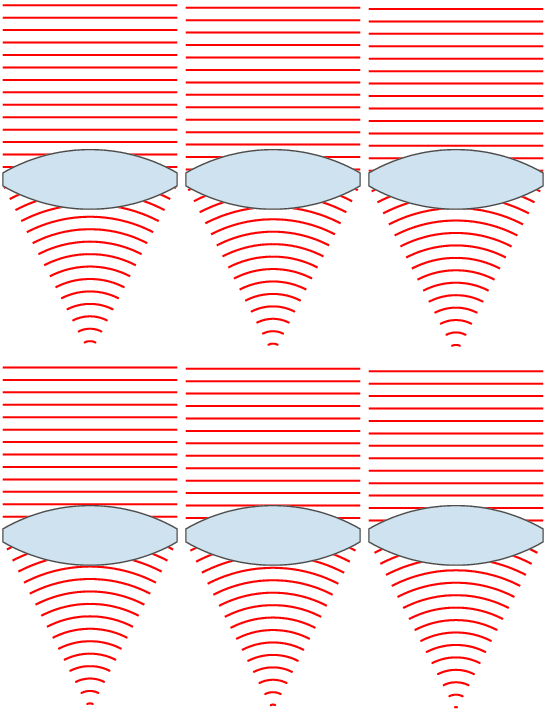
پرونده:Lens and wavefronts.gif

Page contents not supported in other languages.
از ویکی‌پدیا، دانشنامهٔ آزاد

Lens_and_wavefronts.gif(۱۸۳ × ۳۵۶ پیکسل، اندازهٔ پرونده: ۳۵ کیلوبایت، نوع MIME پرونده: image/gif، چرخش‌دار، ۹ قاب، ۰٫۷ ثانیه)

slnglelens

خلاصه

توضیح Illustration of wavefronts after passing through a lens. Interestingly, to produce a point source reverse the direction of the waves, with the focus point acting as a point source.
تاریخ (UTC)
منبع self-made with MATLAB
پدیدآور Oleg Alexandrov
دیگر نسخه‌ها
 
این نمودار با MATLAB ساخته شده است.

اجازه‌نامه

Public domain من، دارنده حق تکثیر این اثر، این اثر را به مالکیت عمومی منتشر می‌کنم. این قابل اجرا در تمام نقاط جهان است.
در برخی از کشورها ممکن است به صورت قانونی این امکان‌پذیر نباشد؛ اگر چنین است:
من اجازهٔ استفاده از این اثر را برای هر مقصودی، بدون هیچ‌گونه شرایطی می‌دهم، تا وقتی که این شرایط توسط قانون مستلزم نشده باشد.

siingleline

% Illustration of planar wavefronts going through a lens and getting focused
% into a converging spherical wave

function main ()

  % lens index
   n=1.5; 

  % number of points, used for plotting
   N = 100;

  % radii of lens surfaces
   R1 = 0.5; 
   R2 = 1.5;

  % centers of circles (y coord is 0)
   O1 = -2.9;
   O2 = -O1;

  % focal length
   f = (n-1)*(1/R1+1/R2); f = 1/f;
   
   % theta0 determines the width of the lens
   theta0=pi/6;
   Theta = linspace(-theta0, theta0, N);

  % right face of the lens
   L1x = R1*cos(Theta)+O1;
   L1y =R1*sin(Theta); 

   % left size of the lens
   L2x=-R2*cos(Theta)+O2;
   L2y = R2*sin(Theta);

   % flat top part
   Topx = [L1x(N), L2x(N)];
   Topy = [L1y(N), L2y(N)];

   % flat bottom part
   Botx = [L1x(1) L2x(1)];
   Boty = [L1y(1), L2y(1)];

   % the lens
   Lensx = [L1x rv_vec(Topx), rv_vec(L2x), Botx];
   Lensy = [L1y rv_vec(Topy), rv_vec(L2y), Boty];

   % Parameters for graphing
   Lens_color  = [204, 226, 239]/256;
   Lens_border = 0.3*[1, 1, 1];
   lbw = 1.3; % lens border width
   wavefr_color = [1, 0, 0];
   wavefr_bdw   = 2;
   
   % spacing between wavefronts (both plane and spherical ones)
   spacing = 0.25;

   % 2*H is the height of the plane wavefronts
   H = L1y(N); 

   % theta2 = slope of the line going from the upper-right
   % end of the lens to the focus point
   theta2 = atan(L1y(N)/(f-L1x(N)));

   % Shape of the spherical wavefronts.
   Theta = linspace(-theta2, theta2, N);
   X = -cos(Theta);
   Y =  sin(Theta);

   S = -f; % start ploting waves from here to the right

   % number of frames in the movie
   num_frames = 10;
   Shifts = linspace(0, spacing, num_frames+1);

   % start at S+shift, plot the wavefronts
   for frame_no = 1:num_frames

      shift = Shifts(frame_no);
      
      s = S+shift;

      % plotting window
      figure(1); clf; hold on; axis equal; axis off;

      % plot the plane wavefronts
      while s < 0
         plot([s, s], [-H, H], 'color', wavefr_color, 'linewidth', wavefr_bdw);
         s = s + spacing;
      end
      
   
      % plot the spherical wavefronts
      s = s - 10*spacing; % backtrack a bit
      while s < f
         
         rho = f-s;
         
         if rho*Y(N) <= L1y(N)
            plot(rho*X+f, rho*Y, 'color', wavefr_color, 'linewidth', wavefr_bdw);
         end
         
         s = s + spacing;
         
      end

      % plot the lens
      fill(Lensx, Lensy, Lens_color, 'EdgeColor', Lens_border, 'LineWidth', lbw);
%      get(H)
%      return
      
      % Invisible points to force MATLAB to keep the
      % plotting window fixed.
      tiny = 0.15*spacing;
      white = 0.999*[1, 1, 1];
      plot(S-tiny,   H+tiny, 'color', white);
      plot(S-tiny,  -H-tiny, 'color', white);
      plot(f+tiny,   H+tiny, 'color', white);
      plot(f+tiny,  -H-tiny, 'color', white);

      % Rotate by 90 degrees
      set(gca, 'View', [90, 90])

      % save current file
      frame_file = sprintf('Frame%d.eps', 1000+frame_no);
      disp(frame_file);
      saveas(gcf, frame_file, 'psc2');
      pause(0.07)
   end

% The frames were converted to a movie with the command
% convert -antialias -loop 10000  -delay 8 -compress LZW Frame100* Lens_and_wavefronts.gif
   
function W = rv_vec(V)

   K = length(V);

   W = V;
   for i=1:K
      W(i) = V(K-i+1);
   end

عنوان

شرحی یک‌خطی از محتوای این فایل اضافه کنید
Siingleline

آیتم‌هایی که در این پرونده نمایش داده شده‌اند

توصیف‌ها

تاریخچهٔ پرونده

روی تاریخ/زمان‌ها کلیک کنید تا نسخهٔ مربوط به آن هنگام را ببینید.

تاریخ/زمانبندانگشتیابعادکاربرتوضیح
کنونی‏۲۵ نوامبر ۲۰۰۷، ساعت ۰۶:۳۵تصویر بندانگشتی از نسخهٔ مورخ ‏۲۵ نوامبر ۲۰۰۷، ساعت ۰۶:۳۵۱۸۳ در ۳۵۶ (۳۵ کیلوبایت)Oleg Alexandrovtweak
‏۲۴ نوامبر ۲۰۰۷، ساعت ۰۴:۱۰تصویر بندانگشتی از نسخهٔ مورخ ‏۲۴ نوامبر ۲۰۰۷، ساعت ۰۴:۱۰۱۷۱ در ۳۵۶ (۳۳ کیلوبایت)Oleg Alexandrovtweak
‏۲۴ نوامبر ۲۰۰۷، ساعت ۰۴:۰۹تصویر بندانگشتی از نسخهٔ مورخ ‏۲۴ نوامبر ۲۰۰۷، ساعت ۰۴:۰۹۱۷۱ در ۳۵۶ (۳۳ کیلوبایت)Oleg Alexandrovtweak
‏۲۴ نوامبر ۲۰۰۷، ساعت ۰۰:۵۶تصویر بندانگشتی از نسخهٔ مورخ ‏۲۴ نوامبر ۲۰۰۷، ساعت ۰۰:۵۶۱۷۱ در ۳۵۹ (۳۳ کیلوبایت)Oleg Alexandrovtweak, same license
‏۲۴ نوامبر ۲۰۰۷، ساعت ۰۰:۵۳تصویر بندانگشتی از نسخهٔ مورخ ‏۲۴ نوامبر ۲۰۰۷، ساعت ۰۰:۵۳۱۷۱ در ۳۵۹ (۳۲ کیلوبایت)Oleg Alexandrovtweak
‏۲۴ نوامبر ۲۰۰۷، ساعت ۰۰:۴۹تصویر بندانگشتی از نسخهٔ مورخ ‏۲۴ نوامبر ۲۰۰۷، ساعت ۰۰:۴۹۱۵۱ در ۳۵۹ (۳۱ کیلوبایت)Oleg Alexandrov{{Information |Description=Illustration of wavefronts after passing through a [:en:lens (optics)|lens]] |Source=self-made with MATLAB |Date=~~~~~ |Author= Oleg Alexandrov |Permission=see below |other_versions= }}

صفحهٔ زیر از این تصویر استفاده می‌کند:

کاربرد سراسری پرونده

ویکی‌های دیگر زیر از این پرونده استفاده می‌کنند:

نمایش استفاده‌های سراسری از این پرونده.