
پرونده:Isotopes and half-life.PNG
اندازهٔ این پیشنمایش: ۵۱۸ × ۵۹۹ پیکسل. کیفیتهای دیگر: ۲۰۷ × ۲۴۰ پیکسل | ۴۱۵ × ۴۸۰ پیکسل | ۶۴۰ × ۷۴۰ پیکسل.
پروندهٔ اصلی (۶۴۰ × ۷۴۰ پیکسل، اندازهٔ پرونده: ۴۰ کیلوبایت، نوع MIME پرونده: image/png)
این پرونده در ویکیانبار موجود است. محتویات صفحهٔ توصیف آن در زیر نمایش داده میشود. |
خلاصه
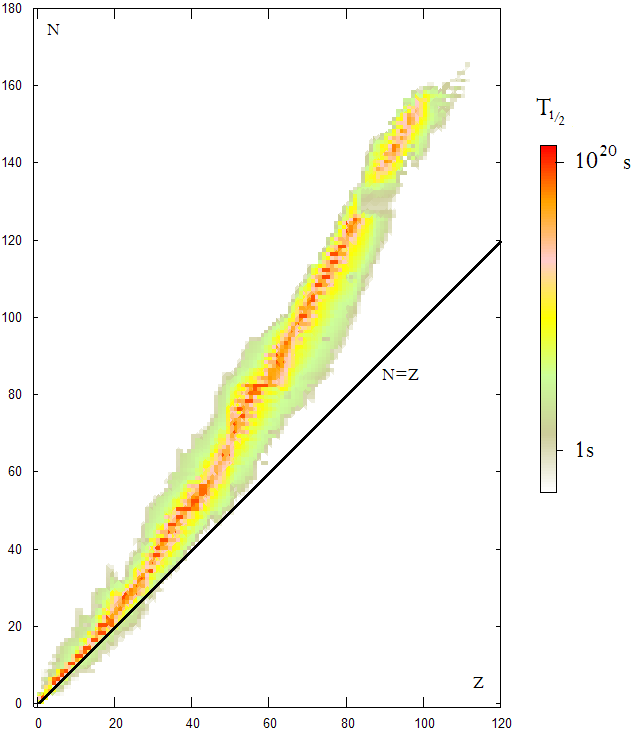
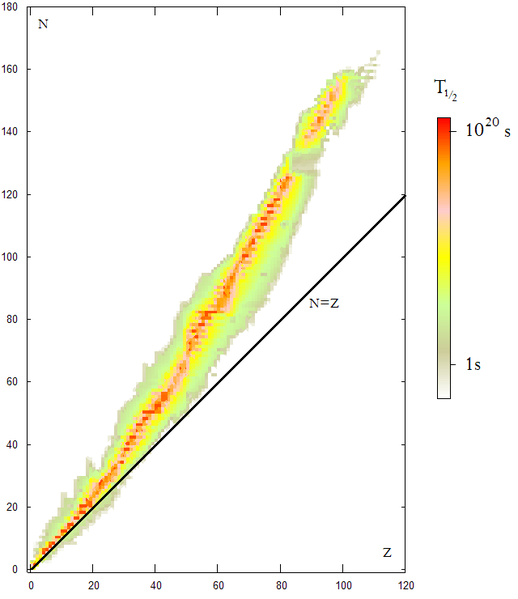
The Nuclear Chart which represent every known nucleus, stable and unstable. Plotted as Z (number of protons) versus N (number of neutrons). The color corresponds to the value of the half-life T½ with a strong log scale, as it varies between and seconds.


|
این graph نگاره میبایست با استفاده از گرافیک برداری اسویجی فایل بازسازی شوند. این چند مزیت دارد؛ Commons:Media for cleanup را برای اطلاعات بیشتر ببینید. اگر حالت برداری آن در حال حاضر موجود است، لطفاً آن را بار کنید. پس از بارکردن یک اسویجی، این الگو را با {{vector version available|new image name.svg}} جایگزین کنید.
|
اجازهنامه
| من، دارنده حق تکثیر این اثر، این اثر را به مالکیت عمومی منتشر میکنم. این قابل اجرا در تمام نقاط جهان است. در برخی از کشورها ممکن است به صورت قانونی این امکانپذیر نباشد؛ اگر چنین است: من اجازهٔ استفاده از این اثر را برای هر مقصودی، بدون هیچگونه شرایطی میدهم، تا وقتی که این شرایط توسط قانون مستلزم نشده باشد. |
تاریخچهٔ پرونده
روی تاریخ/زمانها کلیک کنید تا نسخهٔ مربوط به آن هنگام را ببینید.
| تاریخ/زمان | بندانگشتی | ابعاد | کاربر | توضیح | |
|---|---|---|---|---|---|
| کنونی | ۱۹ اکتبر ۲۰۰۶، ساعت ۲۰:۵۰ | | ۶۴۰ در ۷۴۰ (۴۰ کیلوبایت) | Fffred~commonswiki | Graph of the stability of every known nucleus. Plotted as Z (number of protons) versus N (number of neutrons). The color corresponds to the value of the half-life <math>T_{1/2}</math> |
کاربرد پرونده
این پرونده در هیچ صفحهای به کار نرفته است.
کاربرد سراسری پرونده
ویکیهای دیگر زیر از این پرونده استفاده میکنند:
- کاربرد در ast.wikipedia.org
- کاربرد در br.wikipedia.org
- کاربرد در ca.wikipedia.org
- کاربرد در ca.wikibooks.org
- کاربرد در en.wikibooks.org
- کاربرد در es.wikipedia.org
- کاربرد در fr.wikipedia.org
- کاربرد در fr.wikiversity.org
- کاربرد در gl.wikipedia.org
- کاربرد در id.wikipedia.org