
پرونده:GevDensity.svg

حجم پیشنمایش PNG این SVG file:۶۰۰ × ۶۰۰ پیکسل کیفیتهای دیگر: ۲۴۰ × ۲۴۰ پیکسل | ۴۸۰ × ۴۸۰ پیکسل | ۷۶۸ × ۷۶۸ پیکسل | ۱٬۰۲۴ × ۱٬۰۲۴ پیکسل | ۲٬۰۴۸ × ۲٬۰۴۸ پیکسل | ۶۳۰ × ۶۳۰ پیکسل.
پروندهٔ اصلی (پروندهٔ اسویجی، با ابعاد ۶۳۰ × ۶۳۰ پیکسل، اندازهٔ پرونده: ۱۱۶ کیلوبایت)
این پرونده در ویکیانبار موجود است. محتویات صفحهٔ توصیف آن در زیر نمایش داده میشود. |
خلاصه
| توضیح |
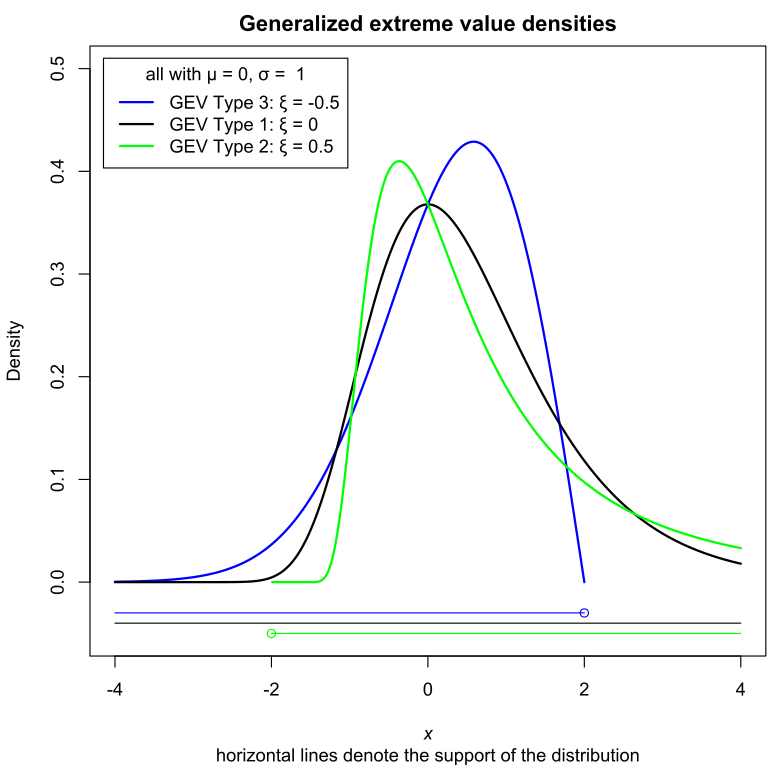
English: Densities of the Generalized Extreme Value (GEV) Distribution for several shape parameters Deutsch: Dichtefunktion der Generalisierten Extremwertverteilung (GEV) für unterschiedliche Formparameter |
| تاریخ | |
| منبع | اثر شخصی بر پایهٔ: GevDensity 2.svg |
| پدیدآور |
|
| دیگر نسخهها |
|
| SVG genesis | کد مبدأ این پروندهٔ گرافیک برداری مقیاسپذیر، معتبر. |
| کد منبع | R codedgev <- function(x, loc = 0, scale = 1, shape = 0){
t1 <- if(shape == 0) {
exp(-(x - loc)/scale)
} else {
(1 + shape * (x - loc)/scale )^(-1/shape)
}
d <- 1/scale * t1^(shape + 1) * exp(-t1)
# setting desity to NA outside of range
outside <- numeric()
if(shape < 0) outside <- x > loc - scale/shape
if(shape > 0) outside <- x < loc - scale/shape
d[outside] <- NA
return(d)
}
draw_support <- function(y, loc = 0, scale = 1, shape = 0, ...) {
if (shape == 0) segments(x0 = par("xaxp")[1], x1 = par("xaxp")[2], y0 = y, ...)
end <- loc - scale/shape
if (shape < 0) segments(x0 = par("xaxp")[1], x1 = end, y0 = y, ...)
if (shape > 0) segments(x0 = end, x1 = par("xaxp")[2], y0 = y, ...)
points(x = end, y = y, pch = 21, ...)
}
x <- seq(-4, 4, 0.01)
shape <- c("3" = -0.5, "1" = 0, "2" = 0.5)
col <- c("blue", "black", "green")
prob <- seq(0, 1, 0.001)
svg("GevDensity.svg")
par(mar = c(5, 4, 2, 0) + 0.1)
plot(NA, xlim=range(x), ylim=c(-0.05, 0.5), type = "n",
xlab = expression(italic(x)), ylab = "Density",
main = "Generalized extreme value densities",
sub = "horizontal lines denote the support of the distribution")
for(i in seq_along(shape)) {
lines(x, dgev(x, shape = shape[i]), col=col[i], lwd = 2)
draw_support(shape = shape[i], col=col[i], y = -i/100 -0.02 )
}
legend("topleft", lwd = 2, col = col, inset = 0.02,
title = "all with \u03bc = 0, \u03c3 = 1",
legend = paste0("GEV Type ", names(shape), ": \u03be = ", shape))
dev.off()
|

اجازهنامه
من، صاحب حقوق قانونی این اثر، به این وسیله این اثر را تحث اجازهنامهٔ ذیل منتشر میکنم:
این پرونده تحت پروانهٔ Creative Commons Attribution-Share Alike 4.0 International منتشر شده است.
- شما اجازه دارید:
- برای به اشتراک گذاشتن – برای کپی، توزیع و انتقال اثر
- تلفیق کردن – برای انطباق اثر
- تحت شرایط زیر:
- انتساب – شما باید اعتبار مربوطه را به دست آورید، پیوندی به مجوز ارائه دهید و نشان دهید که آیا تغییرات ایجاد شدهاند یا خیر. شما ممکن است این کار را به هر روش منطقی انجام دهید، اما نه به هر شیوهای که پیشنهاد میکند که مجوزدهنده از شما یا استفادهتان حمایت کند.
- انتشار مشابه – اگر این اثر را تلفیق یا تبدیل میکنید، یا بر پایه آن اثری دیگر خلق میکنید، میبایست مشارکتهای خود را تحت مجوز یکسان یا مشابه با ا اصل آن توزیع کنید.
تاریخچهٔ پرونده
روی تاریخ/زمانها کلیک کنید تا نسخهٔ مربوط به آن هنگام را ببینید.
| تاریخ/زمان | بندانگشتی | ابعاد | کاربر | توضیح | |
|---|---|---|---|---|---|
| کنونی | ۵ اوت ۲۰۱۵، ساعت ۱۵:۰۶ | | ۶۳۰ در ۶۳۰ (۱۱۶ کیلوبایت) | T.gauster | User created page with UploadWizard |
کاربرد پرونده
صفحهٔ زیر از این تصویر استفاده میکند: