
پرونده:20210827 Global surface temperature bar chart - bars color-coded by El Niño and La Niña intensity.svg

پروندهٔ اصلی (پروندهٔ اسویجی، با ابعاد ۱٬۰۰۰ × ۷۵۰ پیکسل، اندازهٔ پرونده: ۹ کیلوبایت)
این پرونده در ویکیانبار موجود است. محتویات صفحهٔ توصیف آن در زیر نمایش داده میشود. |
خلاصه
| توضیح |
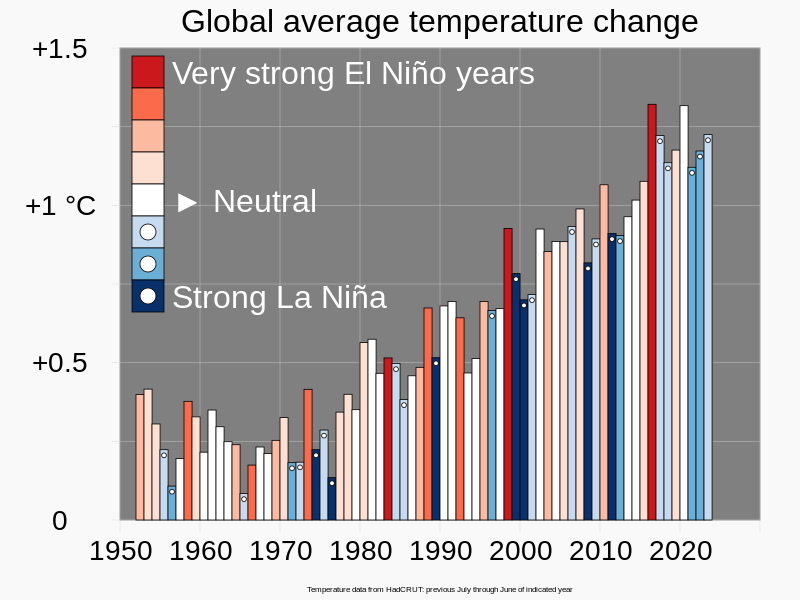
English: Bar chart of global surface temperature, with bars color-coded by El Niño and La Niña intensity.
Chart shows correlation of the (regional) El Niño–Southern Oscillation to global mean surface temperature. Suggested caption:
El Niño and La Niña intensity data is based on a year extending, roughly, from July of one year to June of the following year. Accordingly, I formed 12-month averages of global mean surface temperature anomalies from HadCRUT data extending from July to June, rather than the conventional calendar-year averaging. The height of each bar is determined by temperature change for that time period, and the color of the bar is determined by the El Niño and La Niña intensity category in that time period. The dark background, and black outlines of the individual bars, enable the colors to be seen more vividly. Circles were added to blue bars to help color-blind readers.
|
||
| تاریخ | |||
| منبع | اثر شخصی | ||
| پدیدآور | RCraig09 | ||
| دیگر نسخهها |
آثار انشقاقی از این پرونده: |


اجازهنامه
- شما اجازه دارید:
- برای به اشتراک گذاشتن – برای کپی، توزیع و انتقال اثر
- تلفیق کردن – برای انطباق اثر
- تحت شرایط زیر:
- انتساب – شما باید اعتبار مربوطه را به دست آورید، پیوندی به مجوز ارائه دهید و نشان دهید که آیا تغییرات ایجاد شدهاند یا خیر. شما ممکن است این کار را به هر روش منطقی انجام دهید، اما نه به هر شیوهای که پیشنهاد میکند که مجوزدهنده از شما یا استفادهتان حمایت کند.
- انتشار مشابه – اگر این اثر را تلفیق یا تبدیل میکنید، یا بر پایه آن اثری دیگر خلق میکنید، میبایست مشارکتهای خود را تحت مجوز یکسان یا مشابه با ا اصل آن توزیع کنید.
تاریخچهٔ پرونده
روی تاریخ/زمانها کلیک کنید تا نسخهٔ مربوط به آن هنگام را ببینید.
| تاریخ/زمان | بندانگشتی | ابعاد | کاربر | توضیح | |
|---|---|---|---|---|---|
| کنونی | ۲۳ ژوئیهٔ ۲۰۲۳، ساعت ۱۸:۳۲ | | ۱٬۰۰۰ در ۷۵۰ (۹ کیلوبایت) | RCraig09 | Version 8: MAJOR CHANGES: Adjusted temperature data to be measured with respect to "Pre-industrial levels" (1850-1900). Retained Japanese and Korean language translations in <switch> specifications |
| ۱۸ مهٔ ۲۰۲۳، ساعت ۱۴:۰۳ |  | ۱٬۰۰۰ در ۷۵۰ (۱۱ کیلوبایت) | TAKAHASHI Shuuji | File uploaded using svgtranslate tool (https://svgtranslate.toolforge.org/). Added translation for ja. | |
| ۱ آوریل ۲۰۲۳، ساعت ۰۸:۳۸ |  | ۱٬۰۰۰ در ۷۵۰ (۱۰ کیلوبایت) | Aspere | File uploaded using svgtranslate tool (https://svgtranslate.toolforge.org/). Added translation for ko. | |
| ۳۰ ژانویهٔ ۲۰۲۳، ساعت ۲۰:۰۰ |  | ۱٬۰۰۰ در ۷۵۰ (۸ کیلوبایت) | RCraig09 | Version 5: update to include data through June 2022 | |
| ۲۷ نوامبر ۲۰۲۱، ساعت ۲۰:۴۵ |  | ۱٬۰۰۰ در ۷۵۰ (۸ کیلوبایت) | RCraig09 | Version 4: moving dots near ends of bars to make it easier to see different influence bars . . . making SVG coding a bit more compact | |
| ۲۷ نوامبر ۲۰۲۱، ساعت ۲۰:۴۳ |  | ۱٬۰۰۰ در ۷۵۰ (۸ کیلوبایت) | RCraig09 | Version 3: adding dots to La Nina bars for accessibility for color-blind people | |
| ۲۸ اوت ۲۰۲۱، ساعت ۰۵:۳۲ |  | ۱٬۰۰۰ در ۷۵۰ (۷ کیلوبایت) | RCraig09 | Version 2: Clarify that HadCRUT provided temperature data only | |
| ۲۸ اوت ۲۰۲۱، ساعت ۰۲:۰۲ |  | ۱٬۰۰۰ در ۷۵۰ (۷ کیلوبایت) | RCraig09 | Uploaded own work with UploadWizard |
کاربرد پرونده
صفحهٔ زیر از این تصویر استفاده میکند:
کاربرد سراسری پرونده
ویکیهای دیگر زیر از این پرونده استفاده میکنند:
- کاربرد در cs.wikipedia.org
- کاربرد در en.wikipedia.org
- کاربرد در en.wikiversity.org
- کاربرد در ja.wikipedia.org
- کاربرد در ko.wikipedia.org
- کاربرد در mk.wikipedia.org
- کاربرد در ru.wikipedia.org