
پرونده:Nonquasiconvex function.png
تفکیکپذیری بالاتری در دسترس نیست.
Nonquasiconvex_function.png (۴۷۲ × ۳۹۶ پیکسل، اندازهٔ پرونده: ۱۴ کیلوبایت، نوع MIME پرونده: image/png)
این پرونده در ویکیانبار موجود است. محتویات صفحهٔ توصیف آن در زیر نمایش داده میشود. |
خلاصه
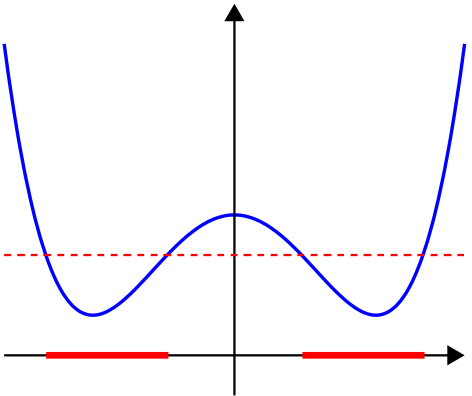
Made by myself with MATLAB

|
این graph نگاره میبایست با استفاده از گرافیک برداری اسویجی فایل بازسازی شوند. این چند مزیت دارد؛ Commons:Media for cleanup را برای اطلاعات بیشتر ببینید. اگر حالت برداری آن در حال حاضر موجود است، لطفاً آن را بار کنید. پس از بارکردن یک اسویجی، این الگو را با {{vector version available|new image name.svg}} جایگزین کنید.
|
اجازهنامه
| من، دارنده حق تکثیر این اثر، این اثر را به مالکیت عمومی منتشر میکنم. این قابل اجرا در تمام نقاط جهان است. در برخی از کشورها ممکن است به صورت قانونی این امکانپذیر نباشد؛ اگر چنین است: من اجازهٔ استفاده از این اثر را برای هر مقصودی، بدون هیچگونه شرایطی میدهم، تا وقتی که این شرایط توسط قانون مستلزم نشده باشد. |
Source code
function main()

% prepare the scrreen and define some parameters
clf; hold on; axis equal; axis off;
fontsize=25; thick_line=3; thin_line=2; black=[0, 0, 0]; red=[1, 0, 0];
arrowsize=0.1; arrow_type=1; arrow_angle=30; % (angle in degrees)

L=1.15;

X=(-L):0.01:(L);
f=inline('2*(X.^4-X.^2+1)-1.3');
Y=f(X);
plot(X, Y, 'linewidth', thick_line)

arrow([X(1) 0], [X(length(X)), 0],          thin_line, arrowsize, arrow_angle, arrow_type, black)
arrow([0 min(Y)-0.4], [0 max(Y)+0.2], thin_line, arrowsize, arrow_angle, arrow_type, black)


a=0.5; Z=X*0+a;
plot(X, Z, 'linewidth', thin_line, 'linestyle', '--', 'color', 'r');

x0=-10;

for i=2:(length(X)-1)
   x=X(i); xp=X(i-1);

   if x < 0 & f(x) < a & f(xp) >= a
      x0=x;
   elseif x < 0 & f(x) >= a & f(xp) < a
      x1=x;
   elseif x > 0 & f(x) <= a & f(xp) > a
      x2=x;
   elseif x > 0 & f(x) >= a & f(xp) < a
      x3=x;
   end
end

plot([x0, x1],  [0, 0], 'linewidth', 2*thick_line, 'color', 'r');
plot([x2, x3],  [0, 0], 'linewidth', 2*thick_line, 'color', 'r');

saveas(gcf, 'Nonquasiconvex_function.eps', 'psc2') % export to eps


function arrow(start, stop, thickness, arrow_size, sharpness, arrow_type, color)

% Function arguments:
% start, stop:  start and end coordinates of arrow, vectors of size 2
% thickness:    thickness of arrow stick
% arrow_size:   the size of the two sides of the angle in this picture ->
% sharpness:    angle between the arrow stick and arrow side, in degrees
% arrow_type:   1 for filled arrow, otherwise the arrow will be just two segments
% color:        arrow color, a vector of length three with values in [0, 1]

% convert to complex numbers
   i=sqrt(-1);
   start=start(1)+i*start(2); stop=stop(1)+i*stop(2);
   rotate_angle=exp(i*pi*sharpness/180);

% points making up the arrow tip (besides the "stop" point)
   point1 = stop - (arrow_size*rotate_angle)*(stop-start)/abs(stop-start);
   point2 = stop - (arrow_size/rotate_angle)*(stop-start)/abs(stop-start);

   if arrow_type==1 % filled arrow

      % plot the stick, but not till the end, looks bad
      t=0.5*arrow_size*cos(pi*sharpness/180)/abs(stop-start); stop1=t*start+(1-t)*stop;
      plot(real([start, stop1]), imag([start, stop1]), 'LineWidth', thickness, 'Color', color);

      % fill the arrow
      H=fill(real([stop, point1, point2]), imag([stop, point1, point2]), color);
      set(H, 'EdgeColor', 'none')

   else % two-segment arrow
      plot(real([start, stop]), imag([start, stop]),   'LineWidth', thickness, 'Color', color);
      plot(real([stop, point1]), imag([stop, point1]), 'LineWidth', thickness, 'Color', color);
      plot(real([stop, point2]), imag([stop, point2]), 'LineWidth', thickness, 'Color', color);
   end
|
|
این math نگاره میبایست با استفاده از گرافیک برداری اسویجی فایل بازسازی شوند. این چند مزیت دارد؛ Commons:Media for cleanup را برای اطلاعات بیشتر ببینید. اگر حالت برداری آن در حال حاضر موجود است، لطفاً آن را بار کنید. پس از بارکردن یک اسویجی، این الگو را با {{vector version available|new image name.svg}} جایگزین کنید.
|
تاریخچهٔ پرونده
روی تاریخ/زمانها کلیک کنید تا نسخهٔ مربوط به آن هنگام را ببینید.
| تاریخ/زمان | بندانگشتی | ابعاد | کاربر | توضیح | |
|---|---|---|---|---|---|
| کنونی | ۲۷ ژانویهٔ ۲۰۰۷، ساعت ۲۰:۲۶ | | ۴۷۲ در ۳۹۶ (۱۴ کیلوبایت) | Oleg Alexandrov | Made by myself with MATLAB |
کاربرد پرونده
صفحهٔ زیر از این تصویر استفاده میکند:
کاربرد سراسری پرونده
ویکیهای دیگر زیر از این پرونده استفاده میکنند:
- کاربرد در de.wikipedia.org
- کاربرد در en.wikipedia.org
- کاربرد در fr.wikipedia.org
- کاربرد در pt.wikipedia.org
- کاربرد در ru.wikipedia.org
- کاربرد در uk.wikipedia.org
- کاربرد در zh.wikipedia.org