
پرونده:Hilbert transform.png
پروندهٔ اصلی (۱٬۶۰۰ × ۱٬۱۲۰ پیکسل، اندازهٔ پرونده: ۱۲۰ کیلوبایت، نوع MIME پرونده: image/png)
این پرونده در ویکیانبار موجود است. محتویات صفحهٔ توصیف آن در زیر نمایش داده میشود. |
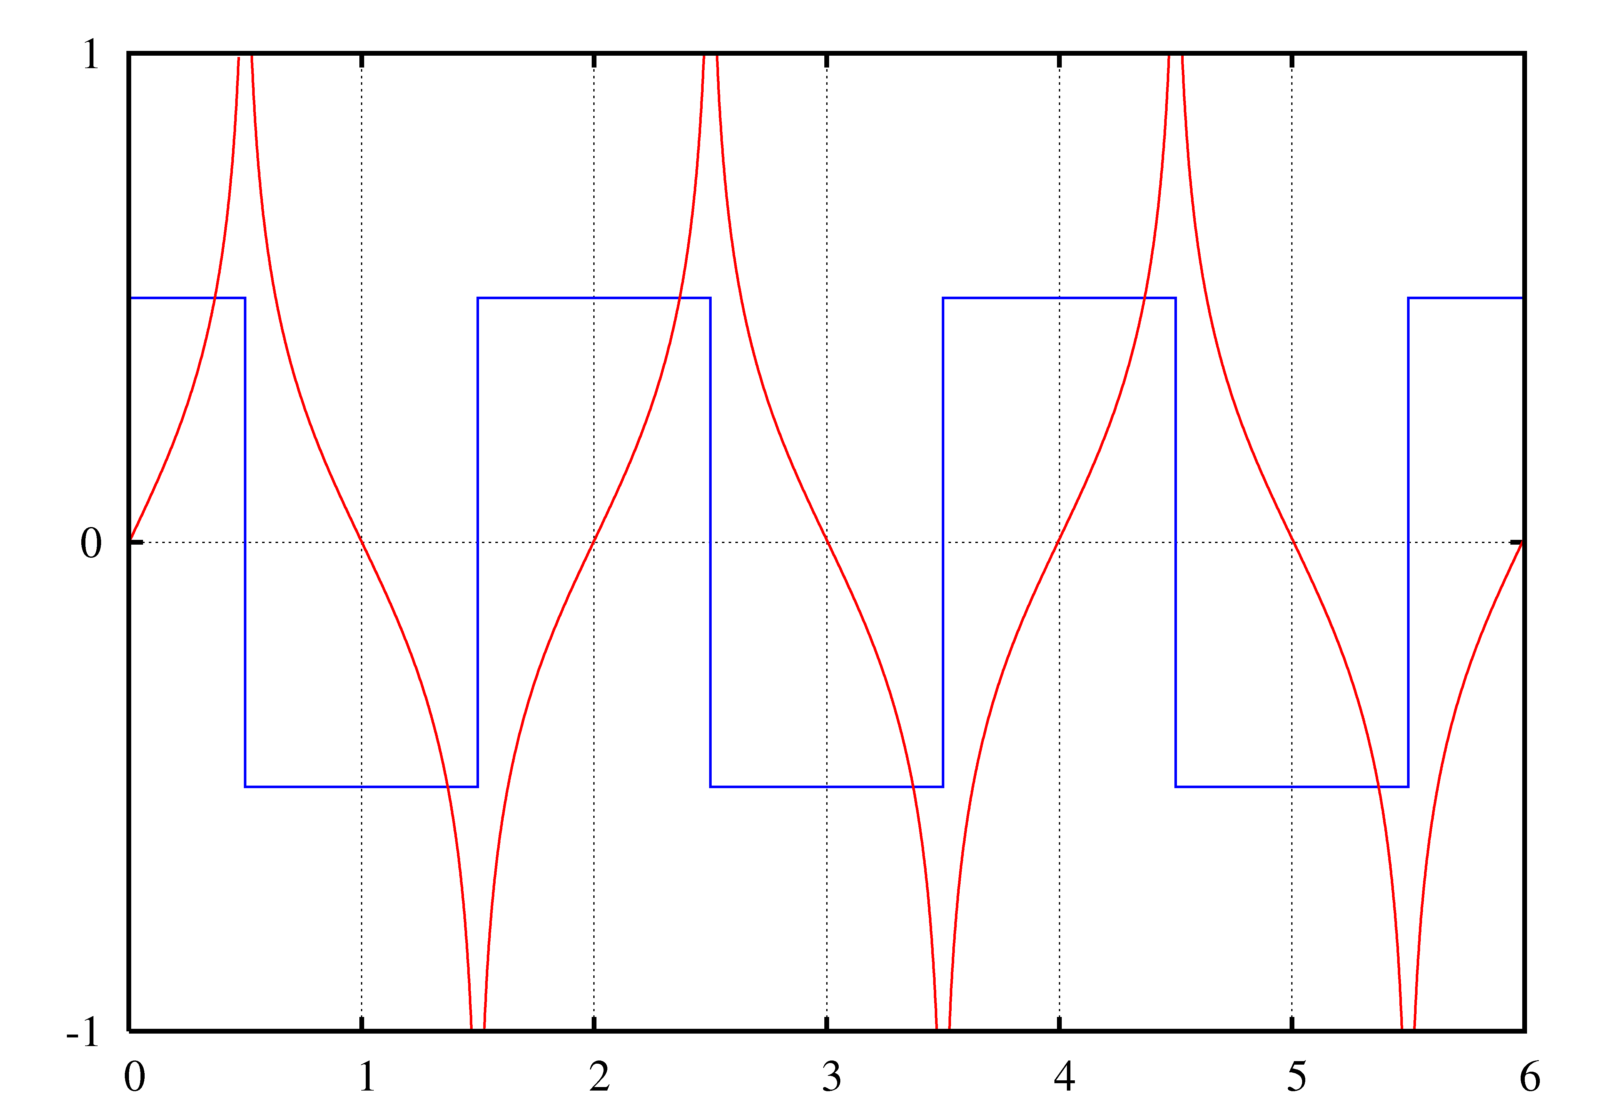
A graph of the Hilbert transform (red) of a square wave (blue).

|
File:Hilbert transform.svg یک نسخهٔ برداری از این پرونده است.
آن پرونده را هنگامی که بهتر بود میبایست به جای این نسخهٔ تصویر استفاده کرد. File:Hilbert transform.png → File:Hilbert transform.svg
برای کسب اطلاعات بیشتر در ارتباط با تصاویر برداری لطفاً اینجا را مطالعهکنید. همچنین اطلاعات بیشتری در ارتباط با حمایت مدیاویکی از تصاویر اسویجی وجود دارد. |
 |
Instructions
See Wikipedia graph-making tips.
Plotted in Maxima with the following commands:
u(t) := 1/2*(1+signum(t));
rect(t) := u(t + 1/2) - u(t - 1/2);
A train of rectangular pulses (or a square wave). This should be n=−∞..+∞, but I can't get Maxima to evaluate it, so I just chose n values that would give a close enough approximation for the visible area:
train(t) := sum(rect(t-2*n),n,-10,20);
The Hilbert transform of a rectangular pulse:
hrect(t) := log(abs((t+1/2)/(t-1/2)))/%PI;
A "train" of hrects. Again with the approximation, though this time it actually matters (rectangular function is 0 everywhere; this is not.):
htrain(t) := sum(hrect(t-2*n),n,-100,100);
The plot command:
plot2d([train(t)-0.5,htrain(t)],[t,0,6],[y,-1,1],[nticks,500], [gnuplot_preamble,"set grid; set ytics 1; set nokey"], [gnuplot_ps_term_command,"set term postscript enhanced landscape color solid lw 2 'Times-Roman' 20"], [gnuplot_term,ps], [gnuplot_out_file,"hilbert.ps"]);
This causes gnuplot to create a .ps file.
To convert the PostScript file to PNG:
- Open it in the GIMP (make sure you have ghostscript installed! - Windows instructions)
- Enter 500 under Resolution (it doesn't say "DPI" but I think that's what it means)
- Uncheck Try bounding box (since the bounding box cuts off the edge, unfortunately. You can try with the bounding box first.)
- Enter large values for Width and Height
- Check Color
- Check Strong anti-aliasing for both graphics and text
- Crop off extra whitespace (Shift+C if you can't find it in the toolbox)
- Possibly need to rotate it: Click Image → Transform → Rotate 90 degrees clockwise
Filters → Blur → Gaussian blur at 2.0 px(No need to blur if you use strong anti-aliasing during conversion. I see no significant difference between end results.)- Image → Scale Image...
- Width and Height at 25%
- Cubic interpolation
- You can view at normal size if you want by pressing 1, Ctrl+E
- Save as Hilbert transform.png
Original version of this plot was made in GNU Octave with the command:
imag(hilbert(x))
Created by User:Omegatron using gnuplot, possibly with post-processing in the GIMP (PNG) or Inkscape (SVG)
- شما اجازه دارید:
- برای به اشتراک گذاشتن – برای کپی، توزیع و انتقال اثر
- تلفیق کردن – برای انطباق اثر
- تحت شرایط زیر:
- انتساب – شما باید اعتبار مربوطه را به دست آورید، پیوندی به مجوز ارائه دهید و نشان دهید که آیا تغییرات ایجاد شدهاند یا خیر. شما ممکن است این کار را به هر روش منطقی انجام دهید، اما نه به هر شیوهای که پیشنهاد میکند که مجوزدهنده از شما یا استفادهتان حمایت کند.
- انتشار مشابه – اگر این اثر را تلفیق یا تبدیل میکنید، یا بر پایه آن اثری دیگر خلق میکنید، میبایست مشارکتهای خود را تحت مجوز یکسان یا مشابه با ا اصل آن توزیع کنید.

|
اجازهٔ کپی، پخش و/یا تغییر این سند تحت شرایط مجوز مستندات آزاد گنو، نسخهٔ ۱٫۲ یا هر نسخهٔ بعدتری که توسط بنیاد نرمافزار آزاد منتشر شده؛ بدون بخشهای ناوردا (نامتغیر)، متون روی جلد، و متون پشت جلد، اعطا میشود. یک کپی از مجوز در بخشی تحت عنوان مجوز مستندات آزاد گنو ضمیمه شده است. |
(In short, this means that you can copy and modify the image freely as long as you provide attribution; preferably in the form of a link back to this page.)
تاریخچهٔ پرونده
روی تاریخ/زمانها کلیک کنید تا نسخهٔ مربوط به آن هنگام را ببینید.
| تاریخ/زمان | بندانگشتی | ابعاد | کاربر | توضیح | |
|---|---|---|---|---|---|
| کنونی | ۲ ژوئیهٔ ۲۰۰۵، ساعت ۱۸:۵۴ | | ۱٬۶۰۰ در ۱٬۱۲۰ (۱۲۰ کیلوبایت) | Omegatron | Image of the Hilbert transform of a square wave. |
| ۲۶ ژوئن ۲۰۰۵، ساعت ۱۹:۵۳ |  | ۶۰۸ در ۴۳۳ (۵ کیلوبایت) | Omegatron | A graph or diagram made by User:Omegatron. (Uploaded with Wikimedia Commons.) Source: Created by User:Omegatron {{GFDL}}{{cc-by-sa-2.0}} Category:Diagrams\ |
کاربرد پرونده
صفحهٔ زیر از این تصویر استفاده میکند:
کاربرد سراسری پرونده
ویکیهای دیگر زیر از این پرونده استفاده میکنند:
- کاربرد در ar.wikipedia.org
- کاربرد در ca.wikipedia.org
- کاربرد در es.wikipedia.org
- کاربرد در fr.wikipedia.org
- کاربرد در zh.wikipedia.org