
پرونده:Temp-sunspot-co2.svg

پروندهٔ اصلی (پروندهٔ اسویجی، با ابعاد ۷۲۰ × ۵۴۰ پیکسل، اندازهٔ پرونده: ۹۸ کیلوبایت)
این پرونده در ویکیانبار موجود است. محتویات صفحهٔ توصیف آن در زیر نمایش داده میشود. |
خلاصه
| توضیح |
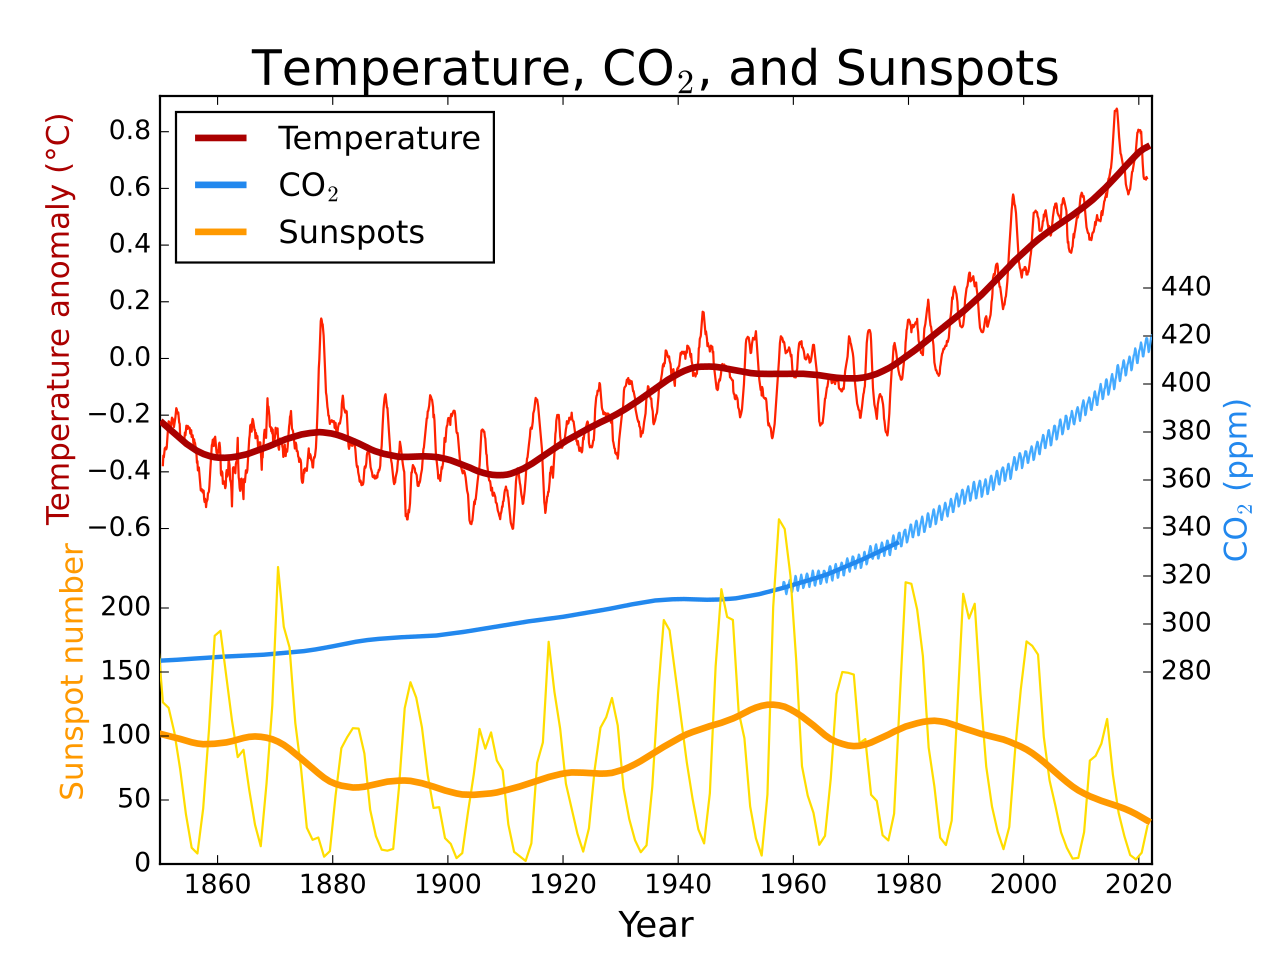
English: Global average temperature, atmospheric CO2, and sunspot activity since 1850. Thick lines for temperature and sunspots represent a 25 year LOWESS and moving average smoothing of the raw data. |
||
| تاریخ | ۱۱ ژانویه ۲۰۰۹ (تاریخ اصلی بارگذاری) | ||
| منبع | Transferred from en.wikipedia to Commons by Anrie using CommonsHelper. | ||
| پدیدآور | Leland McInnes در ویکیپدیا انگلیسی | ||
| دیگر نسخهها |
|
||
| SVG genesis | این نمودار با کد نامعتبر از لحاظ W3C با Matplotlib ساخته شده است
Global average temperature, atmospheric CO2, and sunspot activity since 1850. Thick lines for temperature and sunspots represent a 25 year moving average smoothing of the raw data. This figure was produced by Leland McInnes using python and matplotlib and is licensed under the GFDL. All data is from publicly available sources.
| ||
| کد منبع | Python code#! /usr/bin/env python3
# -*- coding: utf-8 -*-
import numpy as np
import matplotlib.pylab as plt
import matplotlib.ticker as ticker
import urllib3
import ftplib
import shutil
plt.rcdefaults()
plt.style.use('classic')
def saveurl(url, fname):
if url.startswith("ftp"):
ftp = ftplib.FTP('/'.join(url.split('/')[2:3]))
ftp.login('', '')
with open(fname, 'wb') as f:
res = ftp.retrbinary('RETR %s' % '/'.join(url.split('/')[3:]), f.write)
else:
c = urllib3.PoolManager()
with c.request('GET', url, preload_content=False) as resp, open(fname, 'wb') as out_file:
shutil.copyfileobj(resp, out_file)
print('saved', fname, 'from', url)
def smooth_convolution(signal, window_size):
window_size = 1 + 2 * (window_size // 2) # should be odd
w = np.hamming(window_size)
y = (np.convolve(w, signal) / np.convolve(w, np.ones_like(signal)))
return y[(len(w)-1)//2:-(len(w)//2)]
def smooth_lowess(signal, window_size):
s = window_size // 2
window = np.hamming(1+2*s) / np.hamming(1+2*s).sum()
smoothed = np.empty_like(signal)
for i in range(len(signal)):
i0, i1 = max(i-s, 0), min(i+s, len(signal)-1) + 1
# linear LOWESS smoothing
smoothed[i] = np.poly1d(np.polyfit(np.arange(i0, i1), signal[i0:i1], deg=1,
w=np.sqrt(window[i0-i+s:i1-i+s])))(i)
return smoothed
saveurl("http://woodfortrees.org/data/hadcrut4gl/mean:12", "hadcrut4gl.txt")
with open("hadcrut4gl.txt") as temp_file:
temp_years, temps = [], []
for l in temp_file.readlines():
yT = l.split()
if (not l.startswith('#')) and len(yT) == 2:
temp_years.append(float(yT[0]))
temps.append(float(yT[1]))
#print('T', list(zip(temp_years, temps)))
saveurl("ftp://aftp.cmdl.noaa.gov/products/trends/co2/co2_mm_mlo.txt", "co2_mm_mlo.dat")
with open("co2_mm_mlo.dat") as co2_file:
data_rows = [x.split() for x in co2_file if not x.startswith("#") and x.find("-99.99") == -1]
co2_years = [float(x[2]) for x in data_rows]
co2concs = [float(x[3]) for x in data_rows]
#print('co2', list(zip(co2_years, co2concs)))
saveurl("ftp://ftp.ncdc.noaa.gov/pub/data/paleo/icecore/antarctica/law/law_co2.txt", "law_co2.txt")
with open("law_co2.txt", encoding="ISO-8859-1") as lawco2_file:
data_rows = [x.split() for x in lawco2_file if x.startswith(" 1")]
del data_rows[ [float(x[0]) for x in data_rows].index(1010.):]
lawco2_years = [float(x[0]) for x in data_rows]
lawco2concs = [float(x[-1]) for x in data_rows]
#print('lawco2', list(zip(lawco2_years, lawco2concs)))
saveurl("http://www.sidc.be/silso/DATA/SN_y_tot_V2.0.txt", "yearssn.dat")
with open("yearssn.dat") as sunspot_file:
data_rows = [x.split() for x in sunspot_file if "*" not in x]
sun_years = [float(x[0]) for x in data_rows]
sunspots = [float(x[1]) for x in data_rows]
#print('sunspots', list(zip(sun_years, sunspots)))
t_min, t_max = 1850, max(temp_years[-1], co2_years[-1], sun_years[-1])
smoothed_temps = smooth_lowess(temps, 25 * 12)
smoothed_sunspots = smooth_convolution(sunspots, 25)
rect = [0.125, 0.1, 0.775, 0.8]
base_ax = plt.axes(rect)
base_ax.yaxis.tick_left()
plt.yticks([])
plt.xlim(t_min, t_max)
plt.gca().xaxis.set_major_locator(ticker.MultipleLocator(20))
plt.xlabel("Year", size=16)
plt.title(r"Temperature, CO$_2$, and Sunspots", size=22)
temp_ax = plt.axes([rect[0],rect[1]+.42*rect[3],rect[2],.58*rect[3]], frameon=False)
temp_ax.yaxis.tick_left()
plt.plot(temp_years, temps, '#FF2200')
tline = plt.plot(temp_years, smoothed_temps, '#AA0000', lw=3)
plt.xlim(t_min, t_max)
plt.ylim(min(temps)*1.03 - 0.03*max(temps), max(temps)*1.03 - 0.03*min(temps))
plt.yticks(np.arange(-0.6,0.9,0.2))
plt.ylabel(u'Temperature anomaly (°C)', size=14, color='#AA0000')
plt.xticks([])
co2_ax = plt.axes([rect[0],rect[1]+.25*rect[3],rect[2],.5*rect[3]], frameon=False)
co2_ax.yaxis.tick_right()
co2_ax.yaxis.set_label_position("right")
co2_ax.xaxis.tick_bottom()
plt.plot(co2_years, co2concs, '#44AAFF')
cline = plt.plot(lawco2_years, lawco2concs, '#2288EE', lw=2)
plt.xlim(t_min, t_max)
plt.ylabel(r'CO$_2$ (ppm)', size=14, color='#2288EE')
plt.xticks([])
sun_ax = plt.axes([rect[0],rect[1],rect[2],.5*rect[3]], frameon=False)
sun_ax.yaxis.tick_left()
plt.plot(sun_years, sunspots, "#FFDD00")
sline = plt.plot(sun_years, smoothed_sunspots, "#FF9900", lw=3)
plt.xlim(t_min, t_max)
plt.yticks(np.arange(0,250,50))
plt.ylabel("Sunspot number", size=14, color='#FF9900')
plt.xticks([])
plt.sca(base_ax)
t_proxy = plt.Line2D([0], [0], c='#AA0000', lw=3)
c_proxy = plt.Line2D([0], [0], c='#2288EE', lw=3)
s_proxy = plt.Line2D([0], [0], c='#FF9900', lw=3)
plt.legend((t_proxy, c_proxy, s_proxy), ("Temperature", r"CO$_2$", "Sunspots"), loc="upper left")
plt.savefig("Temp-co2-sunspot.svg")
plt.show()
|


Related Images


اجازهنامه
| این پرونده با اجازهنامهٔ کریتیو کامانز Attribution-Share Alike 3.0 سازگار نشده منتشر شده است. به تکذیبنامهها رجوع شود. | ||
| انتساب: Leland McInnes from en.wikipedia.org | ||
| ||
| این برچسب مجوز بهعنوان بخشی از روزآمدسازی مجوز GFDL، به این پرونده افزوده شد. |

|
اجازهٔ کپی، پخش و/یا تغییر این سند تحت شرایط مجوز مستندات آزاد گنو، نسخهٔ ۱٫۲ یا هر نسخهٔ بعدتری که توسط بنیاد نرمافزار آزاد منتشر شده؛ بدون بخشهای ناوردا (نامتغیر)، متون روی جلد، و متون پشت جلد، اعطا میشود. یک کپی از مجوز در بخشی تحت عنوان مجوز مستندات آزاد گنو ضمیمه شده است. به تکذیبنامهها رجوع شود. |
سیاهه بارگذاری اصلی
- 2009-01-11 03:45 Leland McInnes 720×540× (102750 bytes)
- 2008-10-09 00:57 Leland McInnes 600×480× (34962 bytes)
- 2007-03-11 02:47 Leland McInnes 600×480× (48910 bytes) Fix for wrong data selection
- 2007-03-11 02:10 Leland McInnes 600×480× (48672 bytes) Update to Had CRUT3 instead of CRUTEM
- 2007-03-10 20:46 Leland McInnes 600×480× (48525 bytes)
- 2007-03-10 20:41 Leland McInnes 600×480× (47761 bytes)
- 2007-03-10 05:01 Leland McInnes 600×480× (33704 bytes) Global average temperature, Mauna Loa CO<sub>2</sub>, and sunspot activity for the last 50 years.
تاریخچهٔ پرونده
روی تاریخ/زمانها کلیک کنید تا نسخهٔ مربوط به آن هنگام را ببینید.
| تاریخ/زمان | بندانگشتی | ابعاد | کاربر | توضیح | |
|---|---|---|---|---|---|
| کنونی | ۳۰ مهٔ ۲۰۲۲، ساعت ۲۰:۲۳ | | ۷۲۰ در ۵۴۰ (۹۸ کیلوبایت) | Geek3 | update 2022-04 |
| ۹ آوریل ۲۰۲۱، ساعت ۱۳:۱۱ |  | ۷۲۰ در ۵۴۰ (۱۰۶ کیلوبایت) | Geek3 | update 2021-04 | |
| ۲۶ ژوئن ۲۰۲۰، ساعت ۱۳:۰۴ |  | ۷۲۰ در ۵۴۰ (۱۰۵ کیلوبایت) | Geek3 | data update 2020-05, enlarge temperature y-axis | |
| ۶ مارس ۲۰۲۰، ساعت ۱۵:۱۰ |  | ۷۲۰ در ۵۴۰ (۱۰۷ کیلوبایت) | Geek3 | update with 2020 data | |
| ۲۲ ژوئن ۲۰۱۴، ساعت ۲۲:۱۵ |  | ۷۲۰ در ۵۴۰ (۷۶ کیلوبایت) | Kopiersperre | switch from hadcrut3 to hadcrut4 | |
| ۱۱ مارس ۲۰۱۴، ساعت ۲۰:۲۷ |  | ۷۲۰ در ۵۴۰ (۶۲ کیلوبایت) | Kopiersperre | update | |
| ۲۵ ژوئن ۲۰۱۲، ساعت ۲۱:۰۴ |  | ۷۳۱ در ۵۵۱ (۷۵ کیلوبایت) | Johnanth | New version pulled from file discussion, based on the newly updated Python script. | |
| ۲۰ ژوئن ۲۰۱۱، ساعت ۱۸:۳۸ |  | ۷۳۱ در ۵۵۱ (۶۹ کیلوبایت) | Killiondude | http://m8y.org/tmp/wikipedia/ Someone was kind enough to use updated stats and redo it. | |
| ۴ مهٔ ۲۰۰۹، ساعت ۱۲:۱۰ |  | ۷۲۰ در ۵۴۰ (۱۰۰ کیلوبایت) | File Upload Bot (Magnus Manske) | {{BotMoveToCommons|en.wikipedia|year={{subst:CURRENTYEAR}}|month={{subst:CURRENTMONTHNAME}}|day={{subst:CURRENTDAY}}}} {{Information |Description={{en|__NOTOC__ Global average temperature, atmospheric CO<sub>2</sub>, and sunspot activity since 1850. Thi |
کاربرد پرونده
صفحهٔ زیر از این تصویر استفاده میکند:
کاربرد سراسری پرونده
ویکیهای دیگر زیر از این پرونده استفاده میکنند:
- کاربرد در be.wikipedia.org
- کاربرد در bn.wikipedia.org
- کاربرد در ca.wikipedia.org
- کاربرد در de.wikipedia.org
- کاربرد در en.wikipedia.org
- کاربرد در en.wikiversity.org
- کاربرد در es.wikipedia.org
- کاربرد در fr.wikipedia.org
- کاربرد در hu.wikipedia.org
- کاربرد در ig.wikipedia.org
- کاربرد در it.wikipedia.org
- کاربرد در ko.wikipedia.org
- کاربرد در pt.wikipedia.org
- کاربرد در ru.wikipedia.org
- کاربرد در sr.wikipedia.org
- کاربرد در tr.wikipedia.org
- کاربرد در uk.wikipedia.org
- کاربرد در zh.wikipedia.org