
پرونده:Standard deviation.svg

حجم پیشنمایش PNG این SVG file:۵۱۲ × ۴۱۱ پیکسل کیفیتهای دیگر: ۲۹۹ × ۲۴۰ پیکسل | ۵۹۸ × ۴۸۰ پیکسل | ۹۵۷ × ۷۶۸ پیکسل | ۱٬۲۷۶ × ۱٬۰۲۴ پیکسل | ۲٬۵۵۱ × ۲٬۰۴۸ پیکسل.
پروندهٔ اصلی (پروندهٔ اسویجی، با ابعاد ۵۱۲ × ۴۱۱ پیکسل، اندازهٔ پرونده: ۱۲ کیلوبایت)
این پرونده در ویکیانبار موجود است. محتویات صفحهٔ توصیف آن در زیر نمایش داده میشود. |
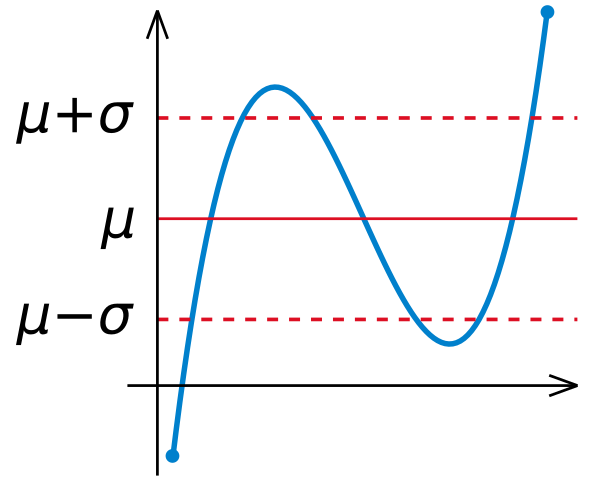
| توضیح | Illustration of en:Standard deviation |
| تاریخ | (UTC) |
| منبع | self-made with MATLAB. Tweaked in Inkscape |
| پدیدآور | Oleg Alexandrov 04:55, 4 August 2007 (UTC) |
| اجازهنامه (استفادهٔ مجدد از این پرونده) |
PD-self |
| من، دارنده حق تکثیر این اثر، این اثر را به مالکیت عمومی منتشر میکنم. این قابل اجرا در تمام نقاط جهان است. در برخی از کشورها ممکن است به صورت قانونی این امکانپذیر نباشد؛ اگر چنین است: من اجازهٔ استفاده از این اثر را برای هر مقصودی، بدون هیچگونه شرایطی میدهم، تا وقتی که این شرایط توسط قانون مستلزم نشده باشد. |
Source code (MATLAB)
% Illustartion of standard deviation
function main()
   a=-1.2; b = 1.3;
   c = -0.5; d = 2.5;
   N=100;

   X=linspace(a, b, N);
   Y=X.^3-0.2*X.^2-X+2;
%   Y=X.^2;

   % scale Y to fit in the plotting window
   Y = (Y-min(Y))/(max(Y)-min(Y));
   Y = Y*(d-c)+c;

   mean = sum(Y)/length(Y);
   stdev = sqrt(sum((Y-mean).*(Y-mean))/length(Y));

   figure(1); clf; hold on; axis off; axis equal;

   lw = 3; % linewidth
   lw2 = lw/2;
   lw3 = lw/1.5;
   fs = 30; % font size
   red=[0.867 0.06 0.14];
   blue = [0, 129, 205]/256;
   green = [0, 200,  70]/256;
   black = [0, 0, 0];

   % plot the curves
   shiftl=a-0.1;
   small=0.2;
   plot(X, Y, 'linewidth', lw, 'color', blue);
   plot([shiftl max(X)+small], [mean, mean], 'linewidth', lw2, 'color', red);
   plot([shiftl max(X)+small], [mean, mean]+stdev, 'linewidth', lw3, 'color', red, 'linestyle', '--');
   plot([shiftl max(X)+small], [mean, mean]-stdev, 'linewidth', lw3, 'color', red, 'linestyle', '--');

% plot some balls for beauty
   n = length(X);
   ball_rad = 0.03;
   ball(X(1), Y(1), ball_rad, blue)
   ball(X(n), Y(n), ball_rad, blue)

% axes
   small=0.2;
   arrowsize=0.2; arrow_type=0;
   angle=20; % in degrees

   arrow([shiftl-0.2 0], [b+0.2, 0],             lw2, arrowsize, angle, arrow_type, black)
   arrow([shiftl, min(Y-0.1)], [shiftl, max(Y)], lw2, arrowsize, angle, arrow_type, black)

% text
   small1 = 0.3; small2 = 0.3;
   text(shiftl-small1, mean,  '\mu', 'fontsize', fs)
   text(shiftl-small1-small2, mean+stdev,  '\mu+\sigma', 'fontsize', fs)
   text(shiftl-small1-small2, mean-stdev,  '\mu-\sigma', 'fontsize', fs)
%   H=text(0.1, -0.1,  'x_{n+1}'); set(H, 'fontsize', fs)
%   H=text(0.7, -0.1,  'x_{n}'); set(H, 'fontsize', fs)

% save to disk
   saveas(gcf, 'Standard_deviation.eps', 'psc2')
%   plot2svg('Standard_deviation.svg');

function arrow(start, stop, thickness, arrow_size, sharpness, arrow_type, color)

% Function arguments:
% start, stop:  start and end coordinates of arrow, vectors of size 2
% thickness:    thickness of arrow stick
% arrow_size:   the size of the two sides of the angle in this picture ->
% sharpness:    angle between the arrow stick and arrow side, in degrees
% arrow_type:   1 for filled arrow, otherwise the arrow will be just two segments
% color:        arrow color, a vector of length three with values in [0, 1]

% convert to complex numbers
   i=sqrt(-1);
   start=start(1)+i*start(2); stop=stop(1)+i*stop(2);
   rotate_angle=exp(i*pi*sharpness/180);

% points making up the arrow tip (besides the "stop" point)
   point1 = stop - (arrow_size*rotate_angle)*(stop-start)/abs(stop-start);
   point2 = stop - (arrow_size/rotate_angle)*(stop-start)/abs(stop-start);

   if arrow_type==1 % filled arrow

% plot the stick, but not till the end, looks bad
      t=0.5*arrow_size*cos(pi*sharpness/180)/abs(stop-start); stop1=t*start+(1-t)*stop;
      plot(real([start, stop1]), imag([start, stop1]), 'LineWidth', thickness, 'Color', color);

% fill the arrow
      H=fill(real([stop, point1, point2]), imag([stop, point1, point2]), color);
      set(H, 'EdgeColor', 'none')

   else % two-segment arrow
      plot(real([start, stop]), imag([start, stop]),   'LineWidth', thickness, 'Color', color);
      plot(real([stop, point1]), imag([stop, point1]), 'LineWidth', thickness, 'Color', color);
      plot(real([stop, point2]), imag([stop, point2]), 'LineWidth', thickness, 'Color', color);
   end


function ball(x, y, r, color)
   Theta=0:0.1:2*pi;
   X=r*cos(Theta)+x;
   Y=r*sin(Theta)+y;
   H=fill(X, Y, color);
   set(H, 'EdgeColor', 'none');
تاریخچهٔ پرونده
روی تاریخ/زمانها کلیک کنید تا نسخهٔ مربوط به آن هنگام را ببینید.
| تاریخ/زمان | بندانگشتی | ابعاد | کاربر | توضیح | |
|---|---|---|---|---|---|
| کنونی | ۴ اوت ۲۰۰۷، ساعت ۰۴:۵۵ | | ۵۱۲ در ۴۱۱ (۱۲ کیلوبایت) | Oleg Alexandrov | {{Information |Description=Illustration of en:Standard deviation |Source=self-made with MATLAB. Tweaked in [:en:Inkscape|Inkscape]] |Date=~~~~~ |Author=~~~~ |Permission=PD-self |other_versions= }} {{PD-self}} Category:Probability theory |
کاربرد پرونده
صفحهٔ زیر از این تصویر استفاده میکند:
کاربرد سراسری پرونده
ویکیهای دیگر زیر از این پرونده استفاده میکنند:
- کاربرد در ar.wikipedia.org
- کاربرد در ckb.wikipedia.org
- کاربرد در is.wikipedia.org
- کاربرد در ms.wikipedia.org
- کاربرد در tr.wikipedia.org
- کاربرد در ur.wikipedia.org