
پرونده:LowSensitivity HighSpecificity 1400x1050.png

اندازهٔ این پیشنمایش: ۸۰۰ × ۶۰۰ پیکسل. کیفیتهای دیگر: ۳۲۰ × ۲۴۰ پیکسل | ۶۴۰ × ۴۸۰ پیکسل | ۱٬۰۲۴ × ۷۶۸ پیکسل | ۱٬۲۸۰ × ۹۶۰ پیکسل | ۱٬۴۰۰ × ۱٬۰۵۰ پیکسل.
پروندهٔ اصلی (۱٬۴۰۰ × ۱٬۰۵۰ پیکسل، اندازهٔ پرونده: ۹۱ کیلوبایت، نوع MIME پرونده: image/png)
این پرونده در ویکیانبار موجود است. محتویات صفحهٔ توصیف آن در زیر نمایش داده میشود. |

|
این diagram نگاره میبایست با استفاده از گرافیک برداری اسویجی فایل بازسازی شوند. این چند مزیت دارد؛ Commons:Media for cleanup را برای اطلاعات بیشتر ببینید. اگر حالت برداری آن در حال حاضر موجود است، لطفاً آن را بار کنید. پس از بارکردن یک اسویجی، این الگو را با {{vector version available|new image name.svg}} جایگزین کنید.
|
خلاصه
| توضیح |
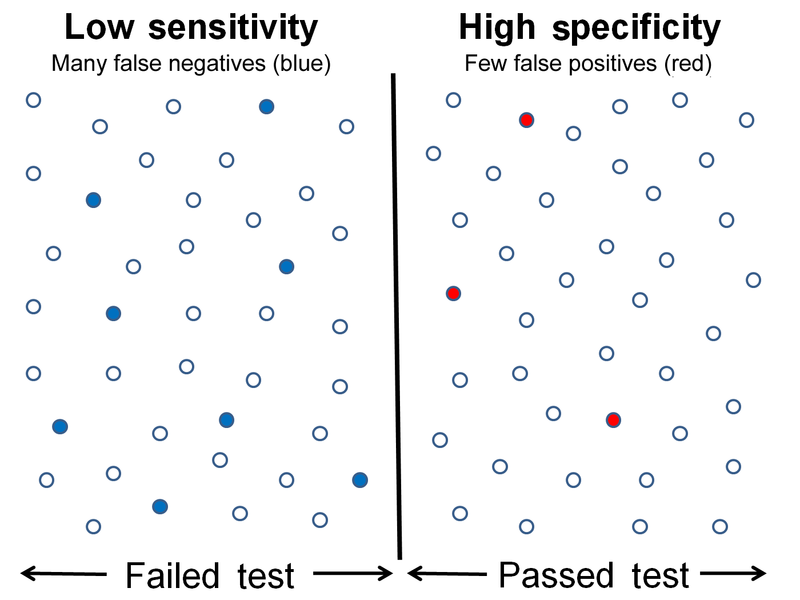
English: Graphical illustration of low sensitivity and high specificity. Each data point is represented by a circle. Data which failed the test are drawn on the left side of the vertical bar and data which passed the test are drawn on the right side of the vertical bar. False negatives are shown as closed blue circles in the left panel and false positives are shown as closed red circles in the right panel. All other data points (open circles) are either true negatives (on the left) or true positives (on the right). |
| تاریخ | |
| منبع | اثر شخصی |
| پدیدآور | Rmostell |
| دیگر نسخهها |
[]
|


اجازهنامه
من، صاحب حقوق قانونی این اثر، به این وسیله این اثر را تحث اجازهنامهٔ ذیل منتشر میکنم:
| این پرونده تحت CC0 1.0 Universal Public Domain Dedication کریتیو کامنز قابل دسترسی است. | |
| کسی که اثری را با این سند همراه کرده است، با چشمپوشی از تمام حقوق خود نسبت به اثر در جهان تحت قانون کپیرایت و همهٔ حقوق قانونی مرتبط یا همسایهای که او در اثر داشته است، تا حد مجاز در قانون، آن را به مالکیت عمومی اهدا کرده است. شما میتوانید بدون گرفتن اجازه این اثر را تکثیر کنید، تغییر دهید، منتشر کنید یا دوباره ایجاد کنید، حتی اگر مقاصد تجاری داشته باشید.
|

|
ردههای این نگاره میبایست بررسی شوند. آنها را الآن بررسی کنید!
|
تاریخچهٔ پرونده
روی تاریخ/زمانها کلیک کنید تا نسخهٔ مربوط به آن هنگام را ببینید.
| تاریخ/زمان | بندانگشتی | ابعاد | کاربر | توضیح | |
|---|---|---|---|---|---|
| کنونی | ۱۵ مهٔ ۲۰۲۰، ساعت ۰۰:۰۶ | | ۱٬۴۰۰ در ۱٬۰۵۰ (۹۱ کیلوبایت) | Nyq | decapitalized common nouns |
| ۶ مارس ۲۰۱۱، ساعت ۲۲:۰۱ |  | ۱٬۴۰۰ در ۱٬۰۵۰ (۷۶ کیلوبایت) | Rmostell | {{Information |Description ={{en|1=Graphical illustration of low sensitivity and high specificity. Each data point is represented by a circle. Data which failed the test are drawn on the left side of the vertical bar and data which passed the test are |
کاربرد پرونده
صفحهٔ زیر از این تصویر استفاده میکند:
کاربرد سراسری پرونده
ویکیهای دیگر زیر از این پرونده استفاده میکنند:
- کاربرد در en.wikipedia.org
- کاربرد در th.wikipedia.org
- کاربرد در ur.wikipedia.org