
پرونده:Butterworth response.svg

پروندهٔ اصلی (پروندهٔ اسویجی، با ابعاد ۵۱۲ × ۳۸۴ پیکسل، اندازهٔ پرونده: ۴۱ کیلوبایت)
این پرونده در ویکیانبار موجود است. محتویات صفحهٔ توصیف آن در زیر نمایش داده میشود. |
خلاصه
| توضیح |
English: This is the SVG version of the PNG image created by Omegatron.
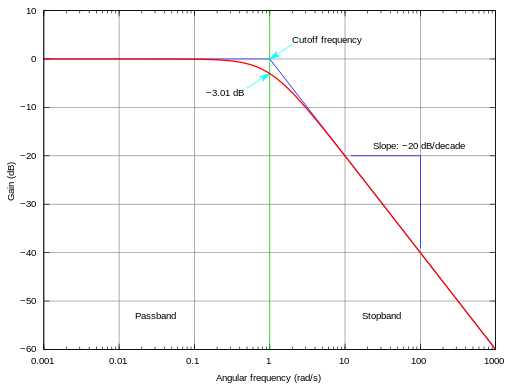
I simply changed the terminal type from PostScript to SVG in the gnuplot script file. The frequency response of a Butterworth filter with logarithmic axes (Bode plot) and various labels. Cutoff frequency is normalized to 1 rad/s. Gain is normalized to 0 dB in the passband.
|
||||
| تاریخ | (UTC) | ||||
| منبع | |||||
| پدیدآور |
|
||||
| دیگر نسخهها |
|
||||
| gnuplot source | click to expand
set samples 2001
# set terminal postscript enhanced landscape color lw 2 "Times-Roman" 20
set terminal svg size 800 600 dynamic enhanced
set output "butterworth.svg"

# Butterworth amplitude response and decibel calculation.  n is the order, which is just 1 in this image.
G(w,n) = 1 / (sqrt(1 + w**(2*n)))
dB(x) = 20 * log10(abs(x))

# Gridlines
set grid

# Set x axis to logarithmic scale
set logscale x 10

# Set range of x and y axes
set xrange [0.001:1000]
set yrange [-60:10]

# Create x-axis tic marks once per decade (every multiple of 10)
set xtics 10

# Use 10 x-axis minor divisions per major division
set mxtics 10

# Axis labels
set xlabel "Angular frequency (rad/s)"
set ylabel "Gain (dB)"

# No need for a key
set nokey #0.1,-25

# Frequency response's line plotting style
set style line 1 lt 1 lw 2

# Draw a separator between passband and stopband and label them
set style line 2 lt 2 lw 1
set style arrow 2 nohead ls 2
set arrow 3 from 1,-60 to 1,10 as 2

# Label coordinates are relative to the graph window, not to the function, centered at the 1/4 and 3/4 width points
set label 1 "Passband" at graph 0.25, graph 0.1 c
set label 2 "Stopband" at graph 0.75, graph 0.1 c

# Asymptote lines and slope lines are the same "arrow" style
set style line 3 lt 3 lw 1
set style arrow 3 nohead ls 3

# Draw asymptote lines
set arrow 1 from 1,0 to 1000,-60 as 3
set arrow 2 from .001,0 to 1,0 as 3

# -3 dB arrow style and arrow
set style line 4 lt 4 lw 1
set style arrow 4 head filled size screen 0.02,15,45 ls 4
set arrow 4 from 2,3 to 1,0 as 4

# "Cutoff frequency" label uses same coordinates as the function
set label 3 "Cutoff frequency" at 2,4 l

# "-3 dB" label
set arrow 5 from 0.5,-6 to 1,-3 as 4
set label 4 "-3.01 dB" at 0.5,-7 r

# Draw slope lines and label
set arrow 6 from 100,-20 to 12,-20 as 3
set arrow 7 from 100,-20 to 100,-39 as 3
set label 5 "Slope: -20 dB/decade" at 100,-18 c

# Plot the filter response
plot
     dB(G(x,1)) ls 1  title "1st-order response"

unset output      # cleanup the handle
|


اجازهنامه
- شما اجازه دارید:
- برای به اشتراک گذاشتن – برای کپی، توزیع و انتقال اثر
- تلفیق کردن – برای انطباق اثر
- تحت شرایط زیر:
- انتساب – شما باید اعتبار مربوطه را به دست آورید، پیوندی به مجوز ارائه دهید و نشان دهید که آیا تغییرات ایجاد شدهاند یا خیر. شما ممکن است این کار را به هر روش منطقی انجام دهید، اما نه به هر شیوهای که پیشنهاد میکند که مجوزدهنده از شما یا استفادهتان حمایت کند.
- انتشار مشابه – اگر این اثر را تلفیق یا تبدیل میکنید، یا بر پایه آن اثری دیگر خلق میکنید، میبایست مشارکتهای خود را تحت مجوز یکسان یا مشابه با ا اصل آن توزیع کنید.

|
اجازهٔ کپی، پخش و/یا تغییر این سند تحت شرایط مجوز مستندات آزاد گنو، نسخهٔ ۱٫۲ یا هر نسخهٔ بعدتری که توسط بنیاد نرمافزار آزاد منتشر شده؛ بدون بخشهای ناوردا (نامتغیر)، متون روی جلد، و متون پشت جلد، اعطا میشود. یک کپی از مجوز در بخشی تحت عنوان مجوز مستندات آزاد گنو ضمیمه شده است. |
سیاهه بارگذاری اصلی
This image is a derivative work of the following images:
- Image:Butterworth_response.png licensed with Cc-by-sa-3.0,2.5,2.0,1.0, GFDL
- 2005-07-23T17:45:55Z Omegatron 1240x880 (87607 Bytes) split the cutoff frequency markers
- 2005-07-23T16:31:54Z Omegatron 1250x880 (94570 Bytes) Better butterworth filter response curve
- 2005-06-26T19:54:33Z Omegatron 250x220 (2251 Bytes) A graph or diagram made by [[User:Omegatron]]. (Uploaded with Wikimedia Commons.) Source: Created by [[User:Omegatron]] {{GFDL}}{{cc-by-sa-2.0}} [[Category:Diagrams]]\
Uploaded with derivativeFX
تاریخچهٔ پرونده
روی تاریخ/زمانها کلیک کنید تا نسخهٔ مربوط به آن هنگام را ببینید.
| تاریخ/زمان | بندانگشتی | ابعاد | کاربر | توضیح | |
|---|---|---|---|---|---|
| کنونی | ۲۵ آوریل ۲۰۱۳، ساعت ۰۹:۵۰ | | ۵۱۲ در ۳۸۴ (۴۱ کیلوبایت) | Incnis Mrsi | dehyphenation |
| ۴ ژوئیهٔ ۲۰۰۸، ساعت ۲۳:۱۷ |  | ۵۱۲ در ۳۸۴ (۴۱ کیلوبایت) | Krishnavedala | {{Information |Description=This is the en:SVG version of the en:PNG image created by en:User:Omegatron. I simply changed the terminal type from en:postscript to SVG in the en:GNUplot script file. The [[w:frequency response|frequency |
کاربرد پرونده
صفحههای زیر از این تصویر استفاده میکنند:
کاربرد سراسری پرونده
ویکیهای دیگر زیر از این پرونده استفاده میکنند:
- کاربرد در ca.wikipedia.org
- کاربرد در cv.wikipedia.org
- کاربرد در de.wikipedia.org
- کاربرد در en.wikipedia.org
- کاربرد در en.wikibooks.org
- کاربرد در eo.wikipedia.org
- کاربرد در es.wikipedia.org
- کاربرد در et.wikipedia.org
- کاربرد در fi.wikipedia.org
- کاربرد در ko.wikipedia.org
- کاربرد در pt.wikipedia.org
- کاربرد در simple.wikipedia.org
- کاربرد در su.wikipedia.org
- کاربرد در uk.wikipedia.org
- کاربرد در vi.wikipedia.org
- کاربرد در zh.wikipedia.org